
Whether you’re marketing a contractor app like JobFLEX, or promoting your local contracting business, it’s extremely valuable to have a basic understanding of key metrics to track to see how well your internet marketing is working. Potential customers search for everything on the internet these days, and contractors are no exception. Knowing this, it’s more important than ever for you to have a well-established online presence. Your website is the hub of all your online marketing activities, and it’s important to have some foundational knowledge to see if, and how, your website is functioning. Google provides a free tool, Google Analytics, that gives you access to a wide variety of metrics to help you measure performance. While it can seem overwhelming at first, Google Analytics is pretty intuitive to navigate after you spend some time with it. Fortunately, we have narrowed down the list to three reports that even beginners can quickly use to measure their website’s performance.
Source/Medium Report
This report is extremely useful as it shows you the sources where the visitors to your website are coming from. This is extremely valuable, especially if you’re paying to have listings in certain directories or lead generation sites or are running online advertising campaigns. Are those sites pushing traffic through to your site? You can find that information here.
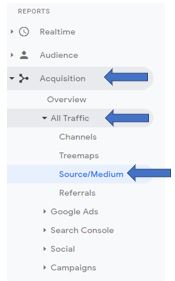
How to Access the Source/Medium Report
- To access this report, first log into your Google Analytics account.
- Find “Acquisition” on the left menu bar.
- Click on Acquisition and a drop-down menu will appear.
- From the drop-down menu, select “All Traffic” and then “Source/Medium”.
These steps will lead you to a report that looks like the one below, with an ordered list of the source and mediums that drove traffic to the site.
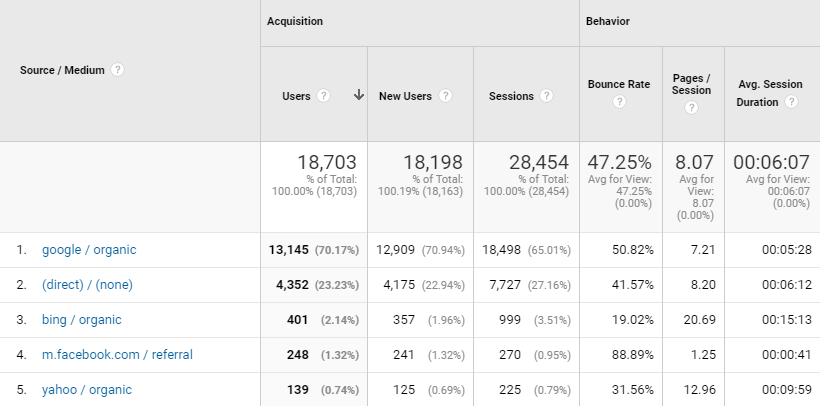
This report provides you with extensive detail about each of the traffic sources for your selected time frame (you can adjust the dates on the top right of the screen). You can see the metrics for each traffic source – how many users they sent to your site, how many of them are new users, the percent bounce rate (users who saw one page and exited), how many pages per session they saw, and how long they stayed on the site. These numbers can give you an idea of the quantity and quality of traffic coming from your various sources.
So, what does all this mean for your contractor business?
You should be paying attention to this report for a few different reasons. One being that it’s important that the sources that you are putting time and money into are performing as they should. For example, if you are spending hours and hours each month trying to promote your business through Facebook, but you’re only getting a little over 1% of your traffic from Facebook like in the table above, you might want to put more time and effort into other traffic sources like organic search. When you look at this report you might notice your email marketing campaign only has a bounce rate of 40% while your traffic coming from Thumbtack has a bounce rate of 90%. With this, you can begin focusing more of your time and efforts on your email marketing campaign and update or discontinue your Thumbtack account.
Landing Pages Report
The landing pages report is another very valuable report that you should be at least looking at as a contractor. It breaks down which pages users are landing on when they hit your site along with the engagement metrics to show you how they behave on each of these pages.
How to Access the Landing Pages Report
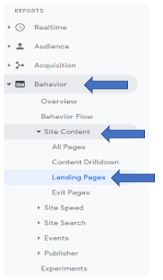
- Log into your Google Analytics account.
- Find “Behavior” on the left menu.
- Click on Behavior and a drop-down menu will appear.
- From the drop-down menu, select “Site Content” and then “Landing Pages”.
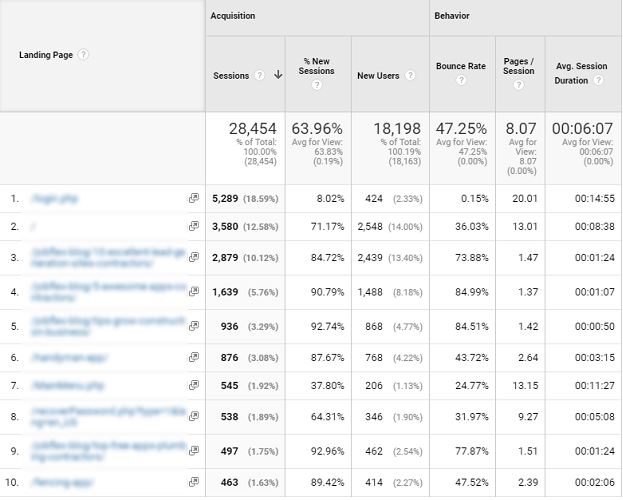
Once you have completed these steps, you’ll get a report that shows an ordered list of the most frequent pages where users have landed on your site.
So, what does all this mean for your contractor business?
Earlier we talked about bounce rates, and that metric is important for looking at your landing page report. This is where you can see which pages are making a good first impression. For example, in the report above the first two pages have bounce rates that are extremely low while the following two pages both have bounce rates over 73%. Considering those pages account for a large amount of site traffic, it would make sense to experiment with those pages to find ways to make them more engaging for your potential customers. After you make edits you can go back and review how effective your changes were by comparing the bounce rates before and after your changes.
Geo Location Report
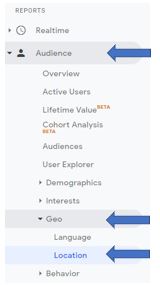
The audience geolocation report provides you with insight into the physical location your visitors are coming from, which is extremely important as a local business owner.
How to Access the Location Report
- Log into your Google Analytics account.
- Find “Audience” on the left menu.
- Click on “Audience” and a drop-down menu will appear.
- From there, select “Geo” and then “Location”.
- At this point just keep clicking your location until you get down to the level of granularity you’re seeking. Usually clicking on United States and then your state should show you what cities are driving the most traffic.
Once you’ve clicked through to your state level you should see a report that looks like this:
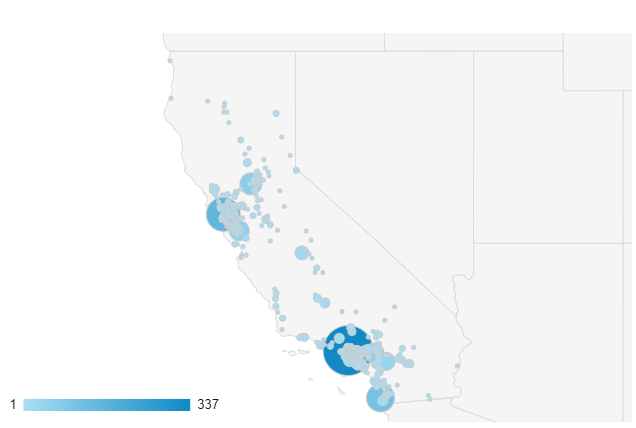
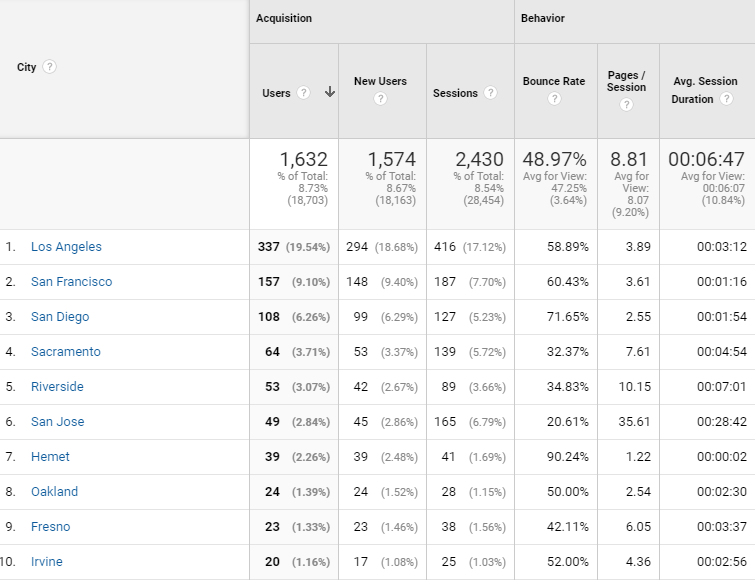
So, what does all this mean for your contractor business?
The previous reports look at traffic and engagement, but without a local focus. This report lets you see if the traffic coming to your site is from within your local area where you actually do business. If you write a blog post that gets you traffic from around the country, that’s all well and good, but if you’re a plumber in Portland, Maine, getting traffic from Alabama isn’t going to turn into business. This report will provide you with a view into how well you’re doing locally.
Advanced Google Analytics: Goal Tracking
The reports above are valuable, albeit basic, reports to help a novice get a sense of how well their website is performing for their business. If you’re interested in taking things a few steps further you should really look into setting up goal tracking. Adding goal tracking will allow you to track things like contact form completions or newsletter sign ups. This adds another critical metric to all of the reports listed here, as you can see which traffic sources, landing pages, and geographic locations are actually causing people to contact your business. This helpful video below will walk you through that process.